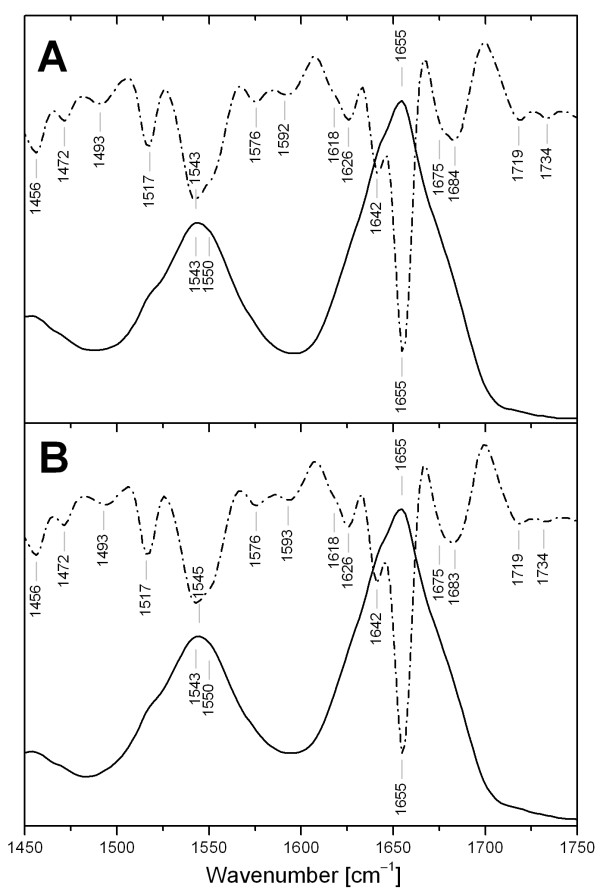
Figure 9.
Infrared spectra of β-N-acetylhexosaminidase. Comparison of the infrared spectra in the amide I and II regions of β-N-acetylhexosaminidase (A) and β-N-acetylhexosaminidase deglycosylated (B). The solid curves represent the original spectra while the dashed curves are associated with the second derivative (15 pts) of the spectra.

