
Figure 2.
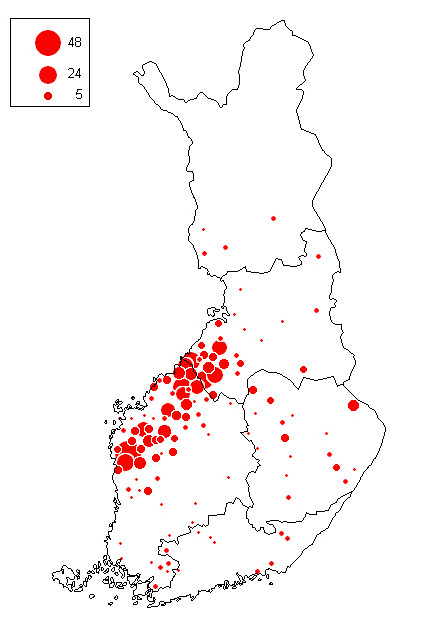
Geographic distribution of S. Infantis cattle farms detected from 1993 to 2005. Each S. Infantis positive farm (n = 478) is shown only once, although S. Infantis isolations were made on some farms in several years. The size of the circle indicates the number of farms (scale in figure) within a municipality.