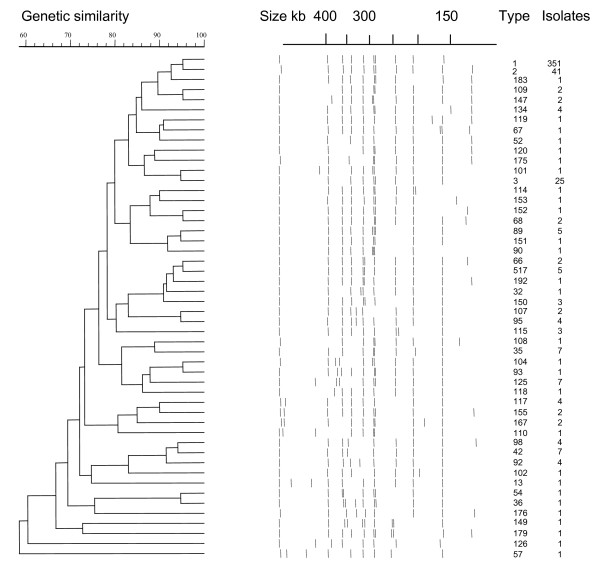
Figure 3.
Dendrogram of 50 PFGE types obtained by XbaI-PFGE of S. Infantis isolates. Only bands larger than 125 kb were counted. The top bar on the left hand side indicates the similarity, with a value of 70 corresponding to an F value of 0.7. The top bar on the right hand side shows the molecular sizes in kilobases (kb). The numbers on the right hand side of the dendrogram and bands indicate the PFGE type (ranging from 1 to 517) and the number of isolates (ranging from 1 to 351) within each type.

