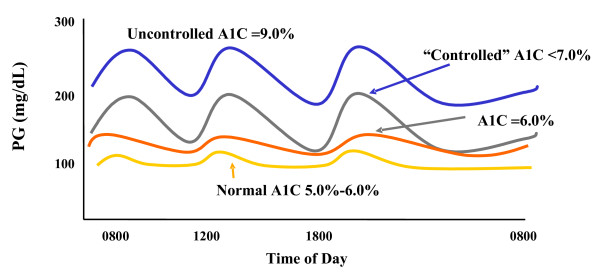
Figure 1.
24-hour glucose profiles for representative patients at different levels of glycemic control. Increasing A1C values reflect an elevated fasting or preprandial (basal) blood glucose level and elevated PPG excursions. At levels shown as "uncontrolled" A1C (9.0%), the culprit is predominantly loss of control of the FPG, whereas the difference between an A1C of upper normal (6.0%) vs "controlled" A1C (7.0%) predominantly reflects increased PPG. (PG = plasma glucose.) Copyright © 2002 From Rationale for and strategies to achieve glycemic control by Cefalu WT. In: Leahy JL, Cefalu WT (eds) Insulin Therapy. Reproduced by permission of Routledge/Taylor & Francis Group, LLC [41].

