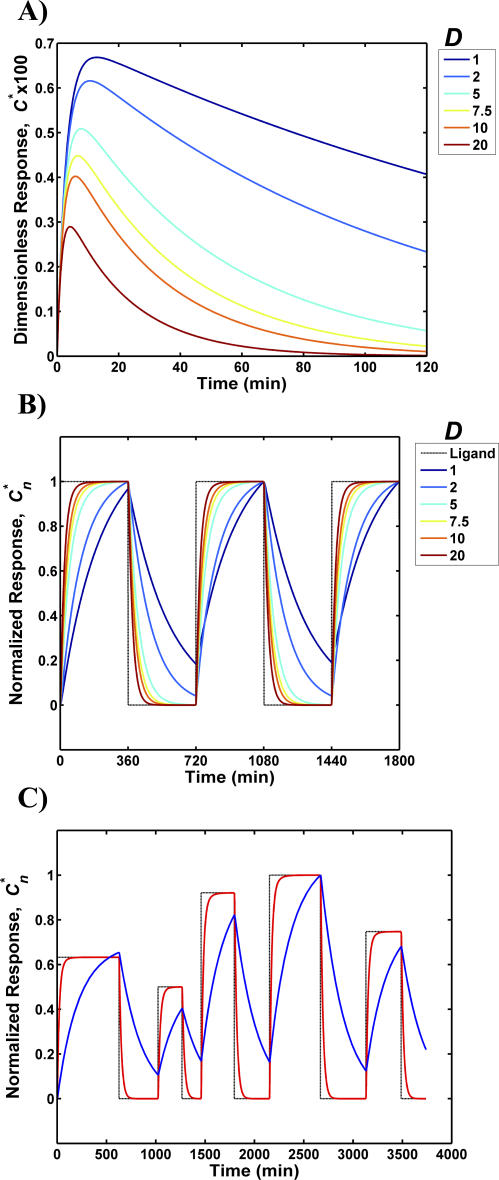
Figure 2. Effect of Downregulation on the Accuracy of EGFR Information Processing.
The dimensionless response C* and the normalized response Cn* of the EGFR system were computed as a function time for various downregulation magnitudes, D.
(A) Impulse response of the EGFR system for various D values.
(B) Normalized response to step changes in the ligand input rate to the system. The input—denoted by a block dotted line—consists of a 360-min stimulus phase where ligand enters the system at a constant rate followed by a 360-min recovery phase where ligand input is set to zero.
(C) Normalized response to a non-uniform step input. The mean value of the ligand entry rate was set such that at steady state sustained ligand release at this rate would leave 95% of the receptors in the unbound form. The mean values of the durations of the on-and-off phases of the step input were set to equal 400 min. The actual ligand entry rate and duration for each pulse was sampled from a normal distribution with a standard deviation of 50%. The response of the EGFR system is plotted for D = 1 (blue line) and D = 20 (red line). The normalized input waveform is shown as a black dotted line.

