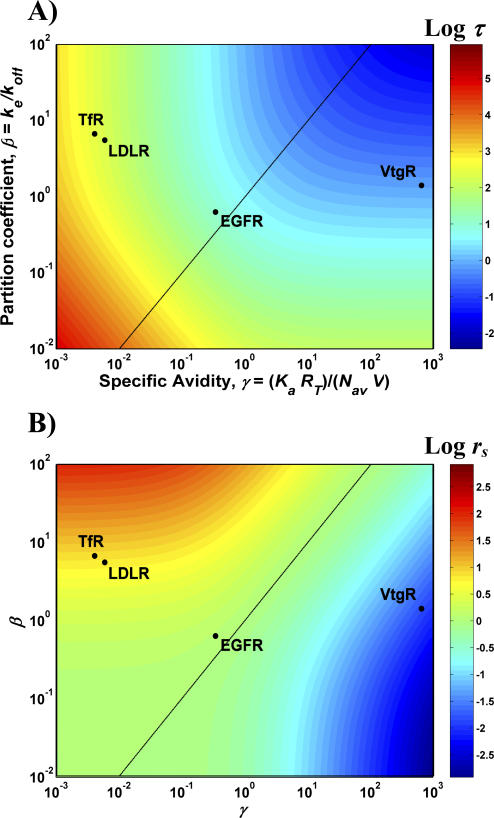
Figure 5. Relaxation Time and Its Sensitivity to Variations in System Parameters.
The relaxation time τ was computed for a range of specific avidity and partition coefficient values by solving the differential equations governing the system.
(A) Dimensionless relaxation time τ is plotted as a function of β and γ. Blue regions correspond to small relaxation times and hence a rapid response, while red regions correspond to large relaxation times and a sluggish response.
(B) The relative sensitivity of the relaxation time to changes in β and γ, rs. Blue regions indicate sensitivity primarily to β alone, and red regions indicate sensitivity to γ alone. The green region in the middle indicates approximately equal sensitivities to β and γ. The β and γ values corresponding to the TfR, LDLR, EGFR, and VtgR are marked in each of the panels. The main diagonal, β = γ is shown as a black line.

