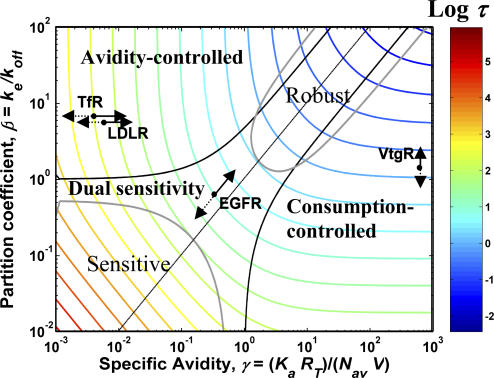
Figure 6. Control Parameters and Their Effect on the Response of Receptor Systems.
The parameter values for EGFR, TfR, LDLR, and VtgR are shown overlaid on a contour plot of the relaxation time. Smaller relaxation times correspond to larger system efficiencies. Arrows depict the effect of changing the respective control parameters on the response for each of the receptor systems. The control parameters are: i) the specific avidity, γ, for TfR and LDLR; ii) the consumption, β, for VtgR; and iii) the downregulation—D with β and γ being altered simultaneously for the EGFR. The most efficient manner in which the response of a given receptor system can be improved is by traveling in a direction normal to the contour lines. Figure 6 illustrates how each of the control parameters can be identified based on their ability to move the system in the appropriate direction in the parameter space. The length of the arrows provides a sense as to which receptors are the most sensitive to parameter changes. The sensitivity is in the order: TfR > LDLR > EGFR > VtgR. Solid arrows indicate the effect of increasing the control parameter, while the broken arrows show the effect of decreasing the parameter. The contours demarcating the most robust (ms < 0.8) and the most sensitive (ms > 1.2) regions of the parameter space are indicated in gray.

