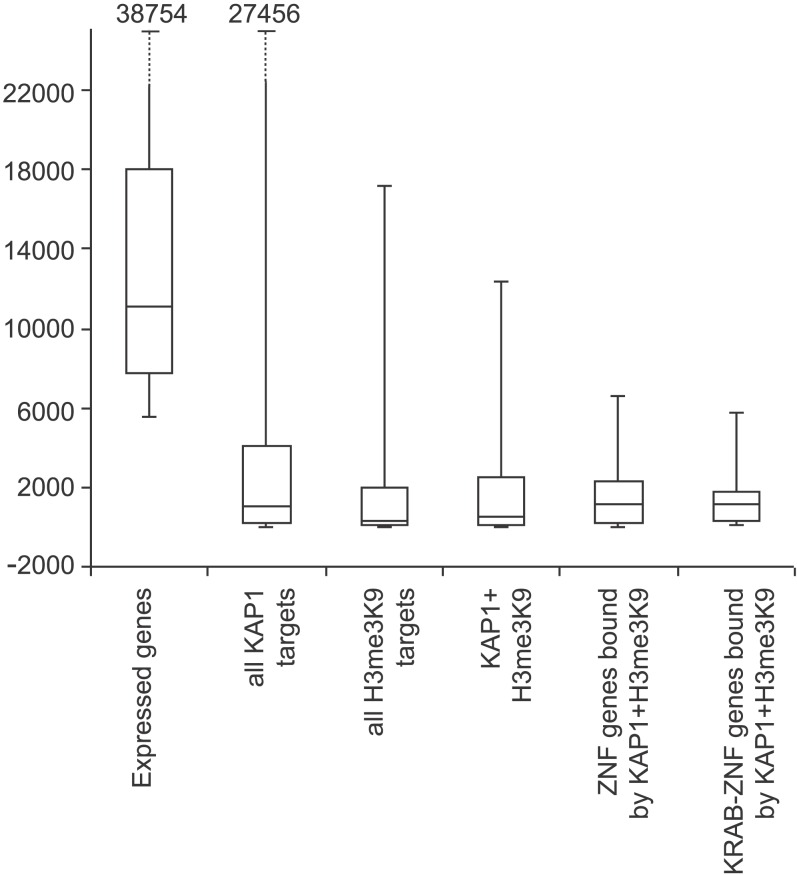
Figure 5. KRAB-ZNF Genes Bound by KAP1 Are Expressed at Low Levels.
Box plot showing 25th, 50th, and 75th quartile expression levels for the most highly expressed RNAs (the top 20% of all RNAs on the array) and for different target gene categories: all KAP1 target genes, all H3me3K9 target genes, genes co-occupied by KAP1 and H3me3K9, ZNF genes co-occupied by KAP1 and H3me3K9, and KRAB-ZNF genes co-occupied by KAP1 and H3me3K9. Whiskers show the 2.5th and 97.5th percentiles. For these analyses, average RNA expression values from two independent experiments were used.

