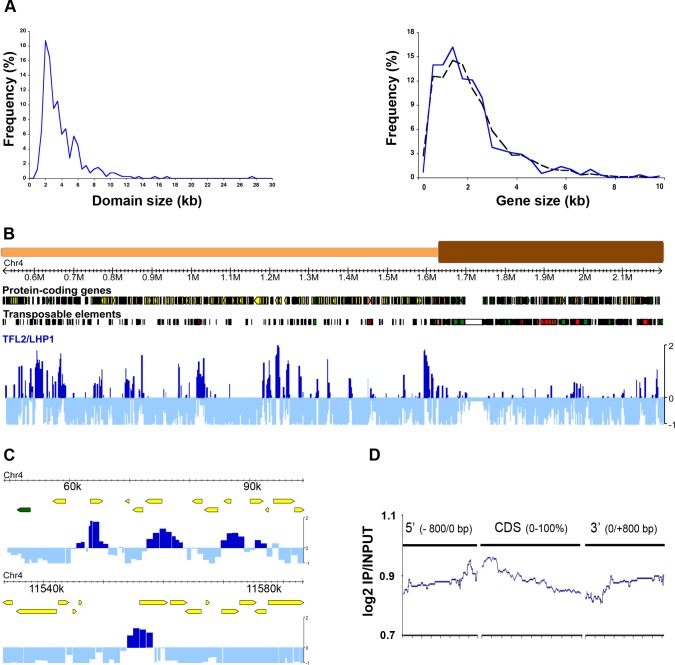
Figure 2. TFL2/LHP1 Associates with Small Euchromatic Gene Domains.
(A) Left panel: Size distribution of domains associated with TFL2/LHP1. Right panel: Size distribution of annotated genes present on Chromosome 4 (black dotted line) and of genes bound by TFL2/LHP1 (blue line). Note the absence of any skewing of the latter set compared to the whole chromosome set.
(B) Genome browser view of a 1.7-Mb region of the short arm of Chromosome 4 (position 0.5 Mb to 2.2 Mb) centered on the distal boundary of the heterochromatic knob and showing the distribution of TFL2/LHP1 targets. Euchromatin and heterochromatin are depicted above the browser view as orange and brown cylinders, respectively. IP/INPUT ratios (log2) reporting significant TFL2/LHP1 association are marked in dark blue.
(C) Genome browser representation of ChIP-chip data over several TFL2/LHP1 target loci. (D) Average value of IP/INPUT ratios along all TFL2/LHP1 target genes and 800 bp of flanking sequences. To accommodate for different gene lengths, positions within genes are indicated as percentage of total length. Highest mean ratios are located around the 5′ end of genes.

