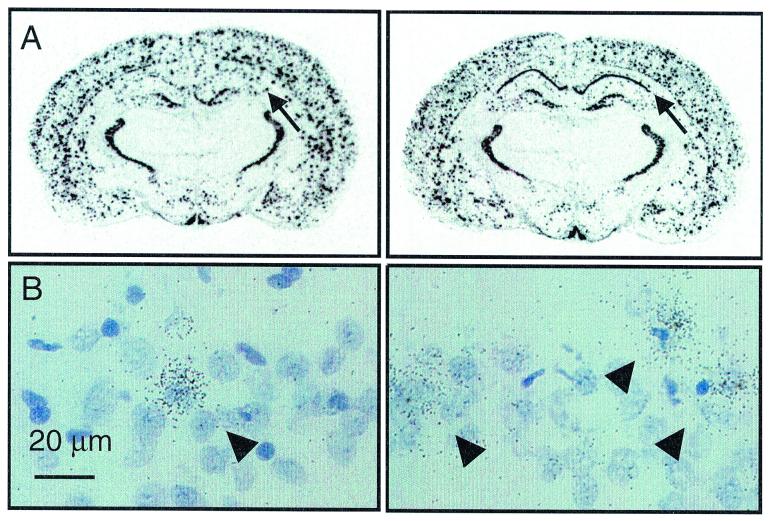
Figure 5.
Coronal sections of two representative subjects at the level of the hippocampus (approximately 2.8 mm posterior to bregma; left, control; right, NPY-tg). Densitometry indicated overexpression of prepro-NPY mRNA in hippocampal fields CA1 and CA2 (P = 0.03). (B) Detailed analysis of emulsion-dipped sections revealed approximately a doubling in the number of NPY-positive cells in this area (P = 0.003; for detailed statistics, see Results).

