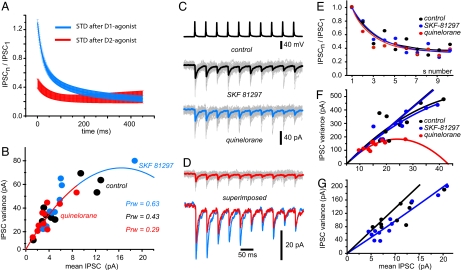
Fig. 5.
Modulation is different for interneurons. (A) Summary plot of all responsive synapses interconnecting SPNs comparing STD kinetics after the D1-class agonist (blue) and D2-class agonist (red) (mean ± SEM). Plots show the lower and upper limits of dopamine-induced STD variation for synapses interconnecting SPNs. (B) Variance-mean analysis in one SPN→SPN connection that responded to both D1- and D2-agonists. If all points are fitted to one parabola (see SI Text), D1-action increases and D2-action decreases release probability. (C) FS→SPN connection. (Top) Presynaptic APs from an FS interneuron evoked IPSCs from a postsynaptic SPN in the control (black) after adding SKF-81297 (1 μM) (blue) (Middle) and after adding quinelorane (1 μM) (red) (Bottom). Note that SKF-81297 had no effects, but quinelorane did. (D) Last two traces (after D1- and D2-agonists) are shown expanded and superimposed. Quinelorane had a clear action: Most IPSCs were reduced. (E) However, there was no change in STD kinetics after any dopamine agonist. (F) Variance-mean analysis of the same FS→SPN connection. The change in initial plot after quinelorane was not significant. (G) In the FS→SPN connection, responsive to the D1-agonist, there was a change in initial slope after variance-mean analysis.

