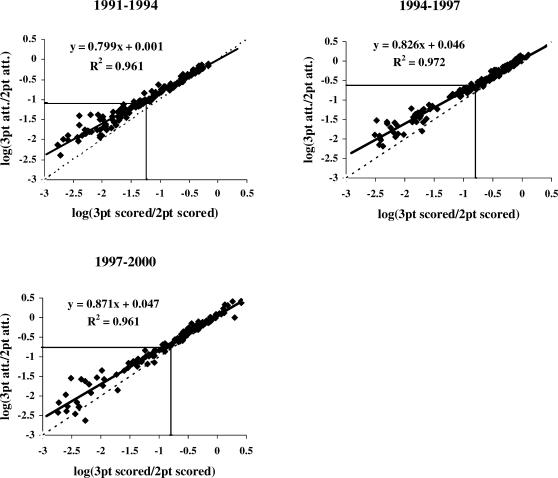
Figure 1.
Log response ratios plotted against log reinforcer ratios for the three different conditions of the study. Data from 57 players who made at least one three-point basket for each 3-year period are included. Each point represents data from one player for one 3-year period. The dashed horizontal lines represent the log of the mean response ratio for all players during each 3-year period. The solid diagonal line is a best fit line for all points. The equation describes the best fit line and displays sensitivity (slope) and bias (y intercept), and the dashed diagonal line represents perfect matching.

