
Figure 5.
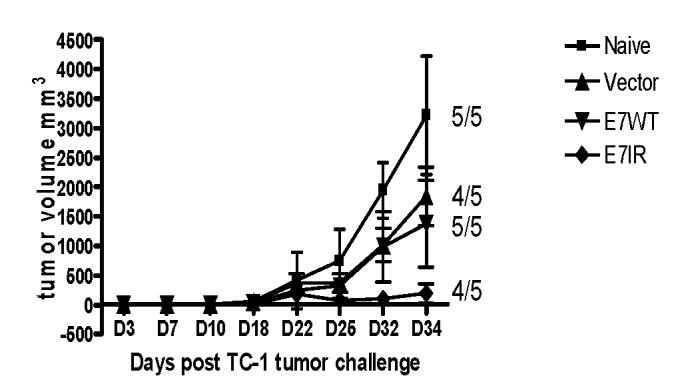
Mean Tumor Volume in Therapeutic E7IR Vaccine Treatment. In therapeutic experiments with the E7IR vaccine, 2×10⁴ TC-1 cells per mouse were injected into 5 mice per group on day 0. After all mice in all groups had a palpable tumor (day 10), the first gene gun vaccination was given, followed by a second vaccination 7 days later. Numbers equal the number of tumor bearing mice in each group at day 34, the last day that all mice were living. Data is representative of two experiments. A composite p value generated from these two experiments indicates that vaccination with the E7IR construct showed a significant decrease in tumor volume compared to vaccination with the E7WT construct (p = 0.01).