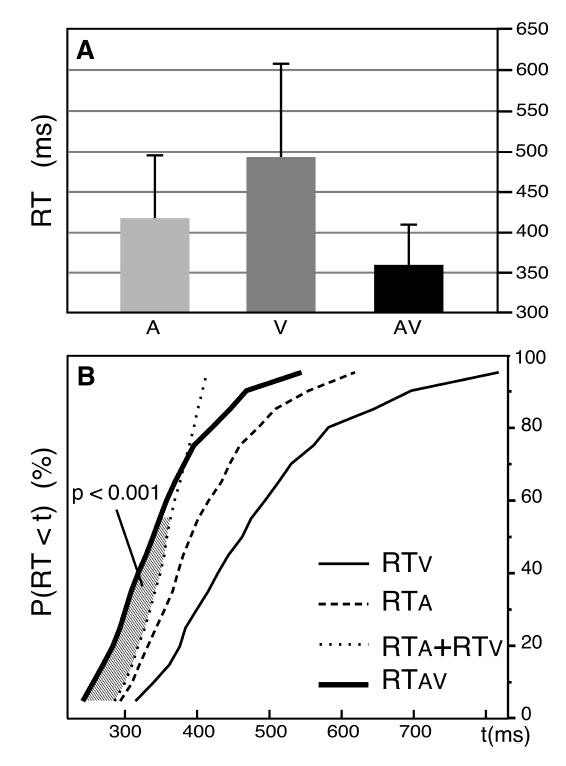
Figure 2. Violation of the Race Model Inequality in the Behavioural-only Experiment.

A: Mean reaction times for the auditory, visual and audiovisual trials. B: Cumulative probability density functions (CDFs) of the reaction times in the three (A, V, AV) conditions of presentation, pooled across subjects. The stimuli and procedure were similar to those used in the main experiment, except that subjects responded to the targets in the 3 conditions. For shorter reaction times, the CDF for AV responses (thick line) is above the sum of the A and V CDFs (thin dotted line). The hatched area between these two curves illustrates the fractiles for which the violation of the race model inequality [P(RTAV < t) ≤ P(RTA < t) + P(RTV < t)] is statistically significant (p<0.001).
