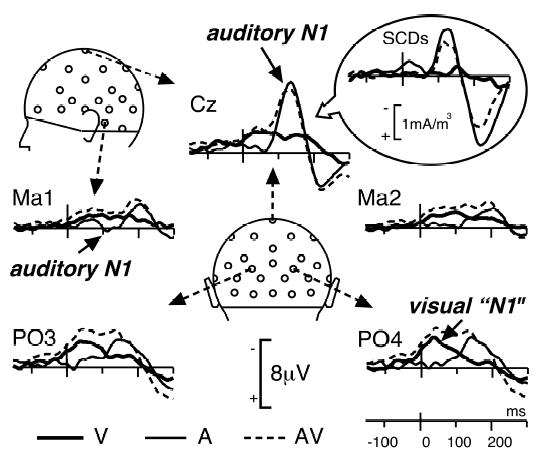
Figure 3. Unimodal and Bimodal Responses.

Grand-average ERPs at 5 illustrative electrodes in each of the 3 conditions of presentation (A, V, AV) from 150 ms before time zero to 300 ms after. The unimodal auditory N1 wave peaks at 136 ms post-stimulus around Cz with small polarity reversals at mastoid sites (Ma1 and Ma2). The visual “N1” wave is maximum around occipito-parietal electrodes (PO3 and PO4) at about 40 ms after time zero (this short latency is due to the fact that lip movements began before time zero). Insert: Grand-average SCDs at Cz are presented to illustrate the difficulty of interpreting interaction effects locally (see Footnote 1).
