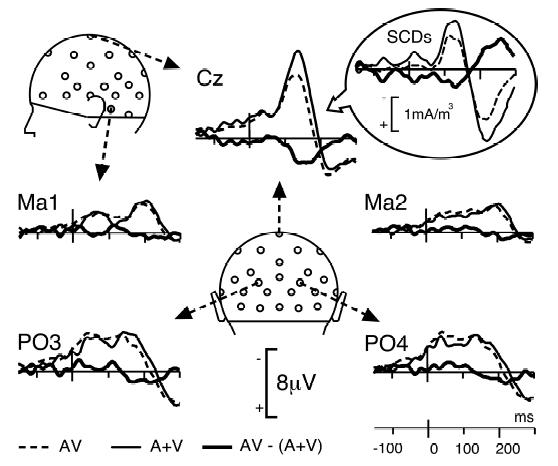
Figure 4. Bimodal vs Sum of Unimodal Responses.

Comparison of the response to bimodal AV stimuli (dotted lines) with the sum (A+V) of the unimodal responses (thin lines) at 5 illustrative electrodes, from −150 to 300 ms. The AV response closely follows the A+V trace, except at central sites (illustrated here at Cz) where the two traces significantly differ from about 120 to 190 ms after time zero (see Figure 5). Insert: For homogeneity with Figure 3, grand-average SCDs are also presented at this electrode.
