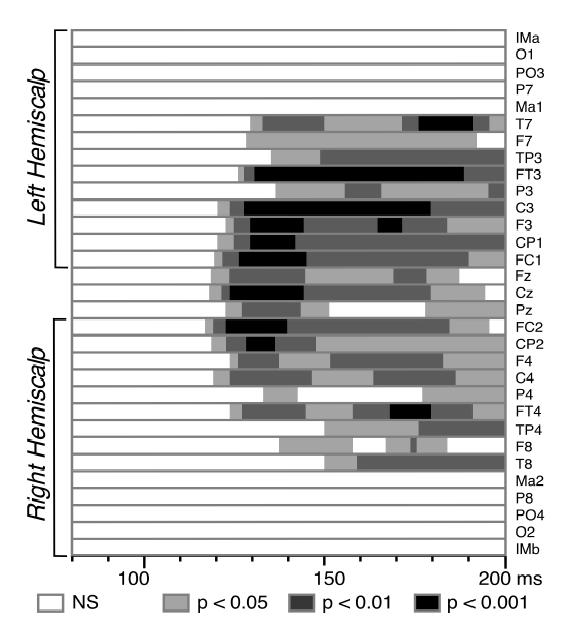
Figure 5. Statistical Significance of the Auditory-Visual Interactions.

Results of the Student’s t-tests -(N=15 subjects) comparing the [AV − (A+V)] amplitudes to zero at each latency from 80 to 200 ms after time zero. Electrodes at the centre of the figure correspond to frontal and central sites and those at the extrema (top and bottom) to more lateral sites. Significant interactions start around 120 ms over fronto-central areas with stronger effects (P < 0.001) on the left hemiscalp.
