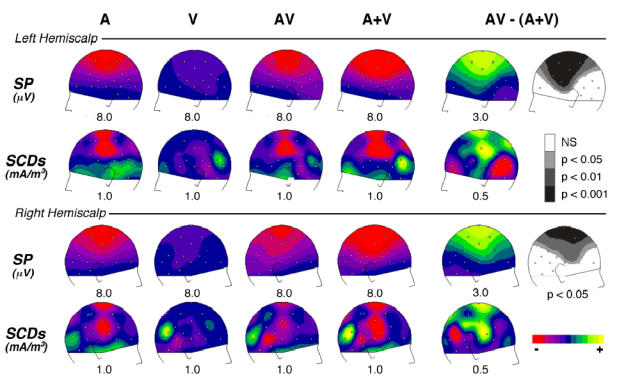
Figure 6. Comparison of the AV Interactions with the Auditory N1 Wave.

Scalp potential (SP) and current density (SCD) topographies over the left and right hemiscalps, at the latency of the unimodal auditory N1 wave (136 ms). Each row displays: left part, the distributions of the auditory (A), visual (V), bimodal (AV) responses and the sum of auditory and visual (A+V) responses; right part, the distributions of the [AV − (A+V)] interaction pattern with the associated Student’s t-map -estimated on potential values at the same latency (136 ms). The grey colours in t-maps -indicate the scalp areas where [AV − (A+V)] significantly differs from zero. In potential and SCD maps, half the range of the scale (in μV or mA/m3) is given below each map. The topography of the crossmodal interaction pattern is similar to that of the unimodal auditory N1 wave, but with opposite polarities. This interaction could therefore reflect a decrease of the unimodal N1 response in auditory cortex.
