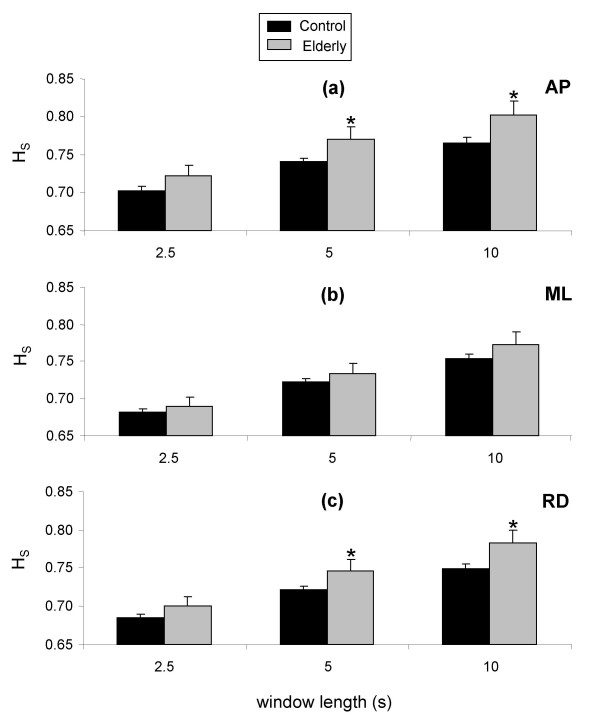
Figure 5.
Differences in HS between control and elderly subjects for 2.5-s, 5-s, and 10-s window lengths anteroposterior (a), mediolateral (b), and resultant (c) displacement. Data are means and 95% confidence intervals for all windows of each window length. *Significantly different from control subjects.

