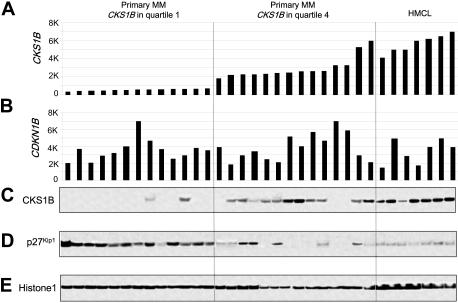
Figure 1.
CKS1B mRNA and protein expression are inversely correlated with p27Kip1 protein levels in primary disease. (A) CKS1B and (B) CDKN1B (p27Kip1) gene expression signal in 1000-unit increments is plotted on the y-axis. Primary myeloma with CKS1B expression in quartile 1 (n = 13) and quartile 4 (n = 14) and MM cell lines (n = 7) are grouped and plotted from left to right along the x-axis. Each bar represents a sample, and the height indicates the level of gene expression in each sample. (C) CKS1B, (D) p27Kip1, and (E) Histone 1 levels were evaluated by Western blot analysis of nuclear fractions derived from the same aliquots of plasma cells used in panels A-B. Samples are ordered from left to right in the exact same order in all panels.

