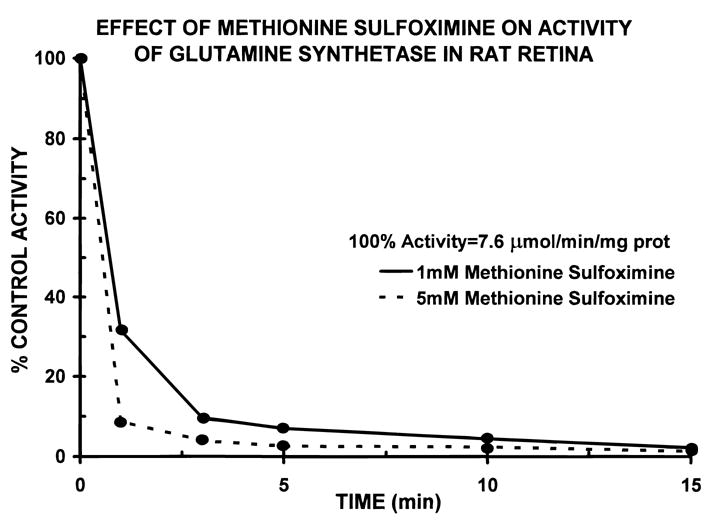
Fig. 1.

Time course of the decline in activity of glutamine synthetase during incubation of isolated rat retinas with 1 mM (solid line) and 5 mM (dashed line) L-methionine sulfoximine. Though not shown, 10 mM MSO yielded an inhibition curve which was similar to the rate of loss of enzyme activity with 5 mM MSO. Each point is the average of eight individual retinas. Standard errors of the mean were smaller than the size of the symbols.
