Figure 3.


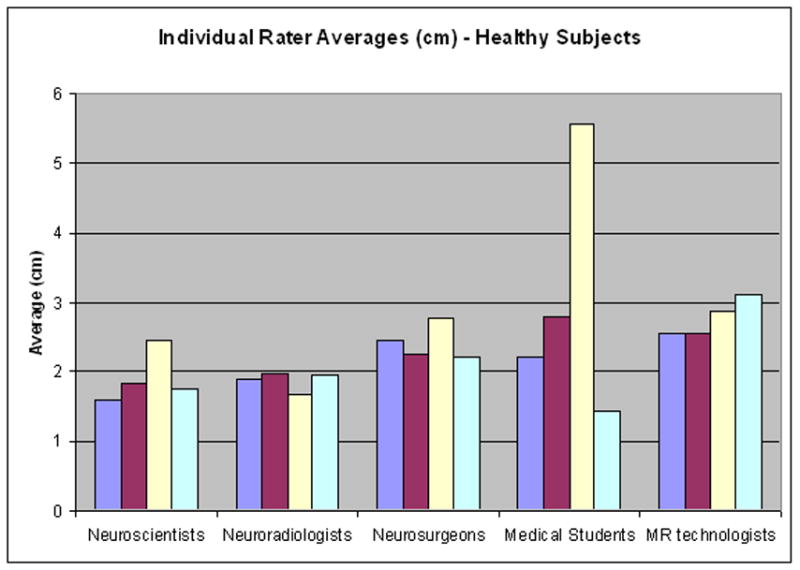
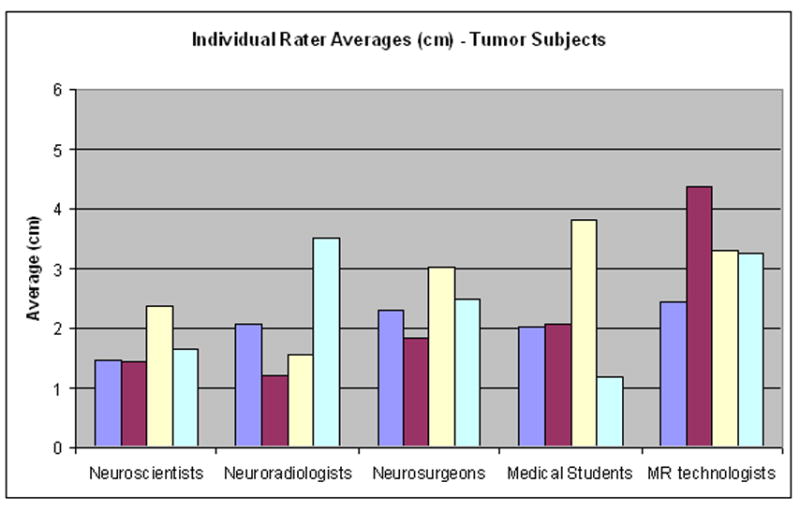
Within group comparison. The mean distance for each individual rater within the groups for both (A) healthy and (B) tumor subjects. Each colored bar represents the average for an individual rater within a group.


Within group comparison. The mean distance for each individual rater within the groups for both (A) healthy and (B) tumor subjects. Each colored bar represents the average for an individual rater within a group.