
Figure 4.
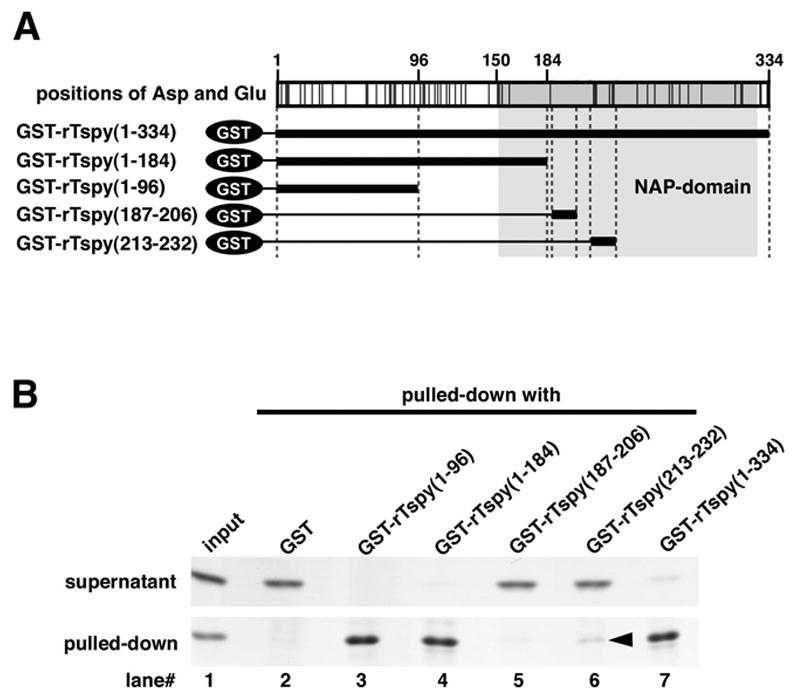
Analysis of the histone H2B binding region in rTspy. (A) Simplified structure of GST-fusion proteins used in GST pull-down assay. Top panel indicates the positions of aspartic acid and glutamic acid in rTspy. The positions of acidic amino acid are indicated by black lines. NAP-domain is shadowed by gray. In lower panel, bold lines indicate the GST-fused region analyzed in B. (B) GST pull-down assay of histone H2B using GST or GST-fusion proteins as indicated. Pulled-down proteins (pulled-down) and proteins of supernatant (supernatant) were subjected to SDS-PAGE, and visualized by Coomassie blue staining. The input represents the material used for GST pull-down assay.