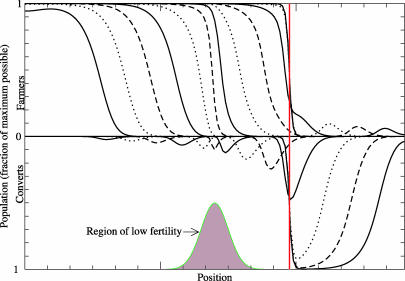
Fig. 1.
Results from test area for population density at a series of times (alternating solid/dotted/dashed lines). The red line shows the final cultural boundary. The wave speed is ≈1.1 km/yr (see SI Applet, with which the reader can explore parameter sensitivity).

