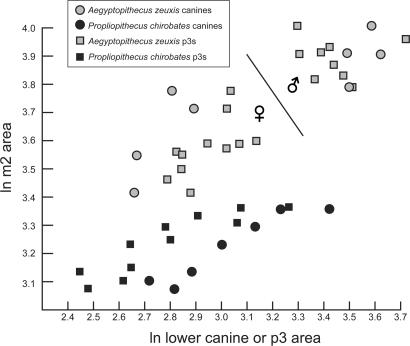
Fig. 2.
Bivariate plot of ln canine or p3 area (x axis) versus ln m2 area (y axis) in A. zeuxis and P. chirobates. Larger individuals falling on the right side of the line dividing the Aegyptopithecus sample are presumed to be males, and smaller individuals on the left side are presumed to be females.

