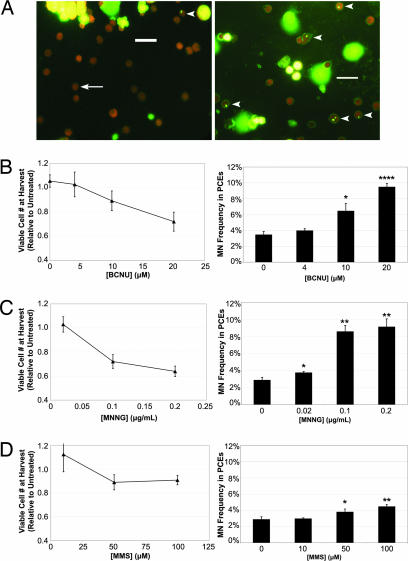
Fig. 2.
Detection of genotoxicity through in vitro erythropoiesis. Purified Lin− cells were cultured in vitro for 1 day on fibronectin-coated plates in medium containing serum, Epo, SCF, dexamethasone, and IGF1. Genotoxic alkylating agents were introduced into the culture media 23 h after seeding. One hour later, the media were changed, and all soluble growth factors and alkylating agents were removed. Populations were then cultured for 2 additional days in media with serum. At harvest, the cells were removed from culture, and genotoxic effects were quantified through viable cell counts and differential cell counts. (A) Representative micrographs are provided from both treated (Right) and untreated (Left) cultures. The arrow indicates a normally enucleated PCE, and the arrowheads indicate micronucleated PCEs. (Scale bars, 20 μm.) (B) The response of this culture system to BCNU treatment is quantified in terms of relative viable cell numbers and MN frequencies. On the left, relative viable cell numbers are plotted vs. BCNU concentration. On the right, MN frequency is plotted vs. BCNU concentration. (C) The response of this culture system to MNNG treatment is quantified in terms of relative viable cell numbers and MN frequencies. (D) The response of this culture system to MMS treatment is quantified in terms of relative viable cell numbers and MN frequencies. Data are presented as the mean of three independent cultures ±SD. ∗ indicates a significant difference (P < 0.05) from untreated control cultures. ∗∗ indicates a significant difference (P < 0.01) from the untreated control cultures. ∗∗∗∗ indicates a significant difference (P < 0.0001) from the untreated control cultures.

