Fig. 3.
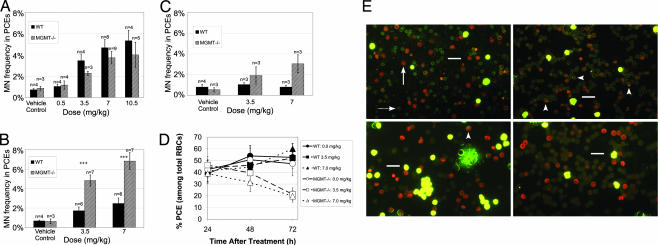
MGMT−/− mice exhibit sensitivity to MN formation after in vivo exposure to BCNU: dynamic quantification of the frequency of PCEs and micronucleated PCEs in BM. WT and MGMT−/− male mice aged 6–8 weeks were treated with either BCNU or vehicle control (PBS/10% EtOH) by i.p. injection. After 24, 48, or 72 h, the treated animals were killed, the BM was flushed from the femurs, and slides were prepared and stained with acridine orange for differential cell counting. Data are presented as the mean ±SD. (A) The MN frequency in BM PCEs was quantified 24 h after exposure to BCNU. (B) The MN frequency in BM PCEs was quantified 48 h after exposure to BCNU. +++ indicates a significant difference (P < 0.001) from WT mice. (C) The MN frequency in BM PCEs was quantified 72 h after exposure to BCNU. (D) The PCE frequency in total BM RBCs was quantified at various times after exposure to BCNU. At 48 h after exposure to BCNU, the BM of MGMT−/− mice was found to contain a reduced frequency of PCEs, and 72 h after exposure, this effect had become even more pronounced. (E) Representative micrographs are shown for BM from the two genotypes examined at various times after treatment with either BCNU (3.5 mg/kg) or vehicle control. The top left micrograph (WT mice 48 h after treatment with vehicle control) is characteristic of untreated, WT BM, with a PCE/RBC ratio between 40% and 60% and a low MN frequency. The arrow indicates a PCE, and the dashed arrow indicates an NCE. The bottom left micrograph is representative of WT BM 48 h after treatment with BCNU (3.5 mg/kg), which has largely recovered to resemble untreated BM (the top left micrograph). The arrowhead indicates a micronucleated PCE. The top right micrograph represents MGMT−/− BM 48 h after treatment with BCNU, which contains an elevated MN frequency among PCEs and a reduced PCE/RBC frequency. The bottom right micrograph illustrates that the decreased PCE/RBC ratio becomes even more pronounced in MGMT−/− BM 72 h after treatment with BCNU. (Scale bars, 20 μm.)

