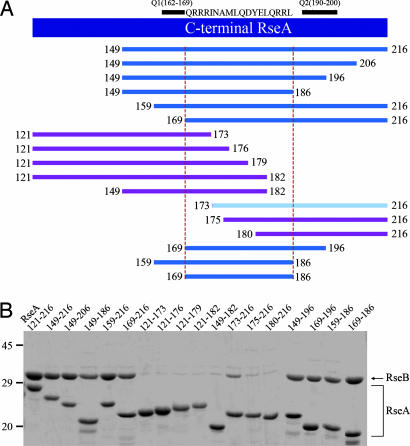
Fig. 3.
Mapping of the RseB-binding fragment of RseA by His pulldown assays. (A) A schematic diagram for the various truncated RseA mutants used in the experiment. The region confined by the red dotted line represents the fragment essential for RseB binding. The blue, cyan, and magenta colors represent strong, weak, and no binding activity to RseB, respectively. Q1 and Q2 are the Gln-rich motifs defined in ref. 12. (B) His pulldown assays to characterize the RseB binding of RseA mutants. The numbers in each lane represent the starting and ending residues. Elution fractions are analyzed in SDS/PAGE. When the RseA mutant has the binding activity of RseB, both RseA and RseB bands are visible in the same lane.

