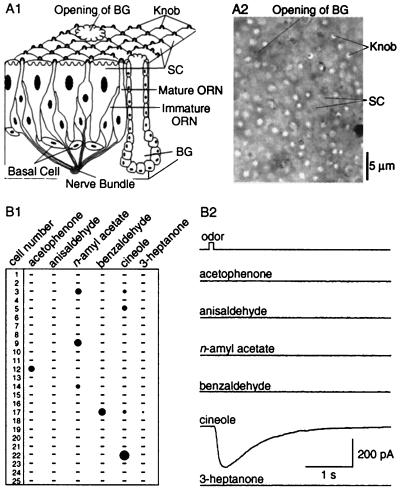
Figure 1.
(A) Visualization of dendritic knobs of mouse ORNs. (A1) Schematic drawing of olfactory epithelium. BG, Bowman's gland. SC, supporting cell. The 10–15 cilia emanating from each knob are not drawn. (A2) The dendritic knobs of mouse ORNs were seen as bright spots in an en face view under infrared differential interference contrast microscope. (B) Responses to different odors by single ORNs, revealed by perforated patch-clamp recordings. (B1) The table summarizes the responses of 25 cells to six different odors. Identical 100-ms pulses of six different odors at 300 μM were sequentially delivered to a cell. The interval between two consecutive pulses was >30 sec. If a cell did not respond to a mixture of the six odors, it was considered not to respond to any individual odor. The area of a filled circle represents the relative amplitude of the odor-induced current; a dash indicates no detectable current. The holding potential was −60 mV. The cells were chosen randomly from all areas of olfactory epithelium. (B2) Raw data from cell 22. Of the six odors, the cell responded only to cineole.

