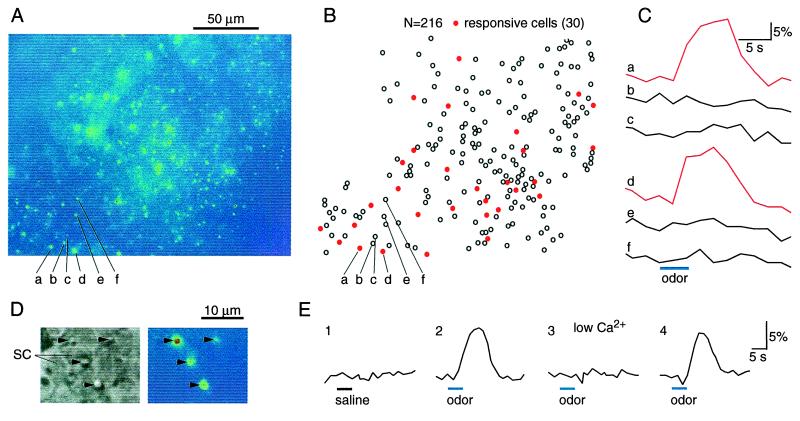
Figure 2.
Imaging odor responses of mouse ORNs in the intact epithelial preparation by calcium imaging techniques. (A) The preparation was viewed under fluorescence illumination, after being loaded with calcium green. (B) A total of 216 dendritic knobs are mapped for further analysis. Each circle represents a cell. Red circles (30 of 216) stand for the responsive cells to a 4-sec odor stimulus (a mixture containing 10 μM of each of the six odors listed in Fig. 1B). (C) The fluorescence intensity changes (ΔF/F) induced by the odor stimulus are measured and calculated for individual dendritic knobs; the traces corresponding to cells a–f are shown. (D) Comparison between transmitted (Left) and fluorescent (Right) images confirmed that the bright spots were dendritic knobs. The arrows mark the dendritic knobs. SC, supporting cell. (E) The fluorescence changes (ΔF/F) induced by odor stimulation was caused by calcium entry. Perfusion of saline (trace 1) or removal of Ca2+ (trace 3) eliminated odor-induced fluorescence changes. The stimulus was saline (trace 1) or an odor mixture as in Fig. 1B (traces 2–4). The bath was normal (traces 1, 2, and 4) or low Ca2+ saline (trace 3).

