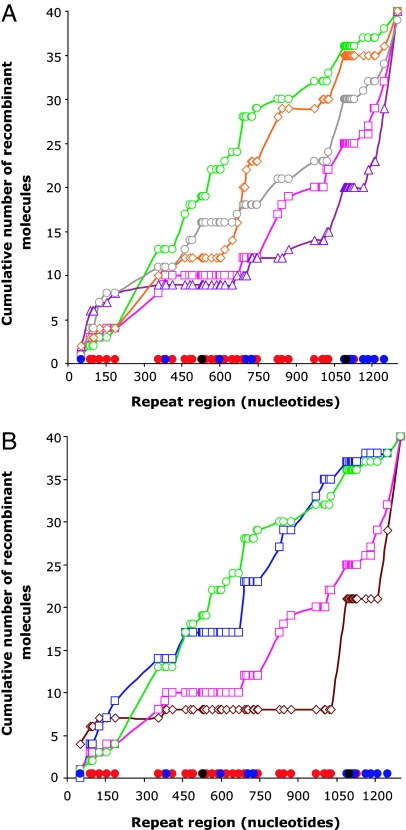
Fig. 4.
Structure of lacZ+ recombinants as a function of cellular MutL and MutS level. For each recombinant, the junction is assigned to a region delimited by mismatches in aligned lacZ repeats. The cumulative distribution of junction positions for the strains examined is shown. Mismatches that are well (red filled circles; G–T and A–C), less efficiently (blue filled circles; A–G and C–T), or not at all (black filled circles; C–C) recognized by the MMR system are shown on the x axes. (A) RecA-dependent lacZ+ recombinants. Wild-type strain (pink open squares and lines), mutL strain (green open circles and lines), strain with 4-fold less MutL (red open diamonds and lines), wild-type strains overexpressing MutL (purple open triangles and lines), and MutS proteins (gray open circles and lines) are shown. (B) RecA-independent lacZ+ recombinants. recA strain (brown open diamonds and lines) and recA mutL strain (blue open squares and lines) are shown. For comparison wild-type strain (pink open squares and lines) and mutL strain (green open circles and lines) are given. For sequencing protocol see SI Text.

