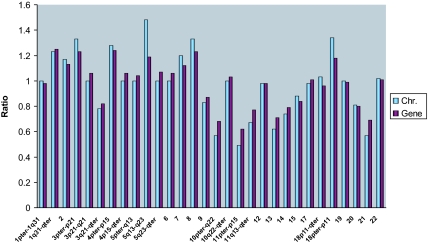
Fig. 2.
Comparing chromosomal copy number ratio to the chromosome transcriptome ratio. The copy numbers of each chromosome in DB-P and DB-A2 were determined by SKY and FISH and are presented in Tables 1 and 2. The ratios of chromosome numbers for DB-A2 versus DB-P were determined by comparing the total number of chromosome or subchromosomal region in 10 metaphases. The chromosome transcriptome ratios were obtained by averaging the expression of all available genes on each chromosome or subchromosome region, and values determined in log2 units were converted to numerical ratios.

