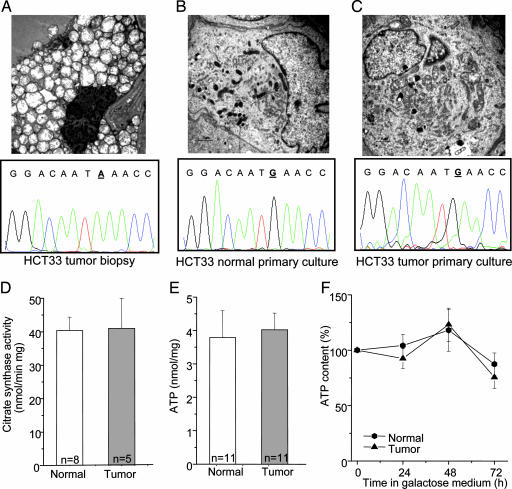
Fig. 3.
Characterization of normal and tumor primary cell cultures. (A–C) Ultrastructure of thyroid tumor biopsy shows mitochondrial hyperplasia (A Upper) lacking in normal and tumor primary cultures (B Upper and C Upper). Electropherograms showing the mutated base (bold and underlined) in the tumor biopsy and the wild-type base at the same position in both normal and tumor primary culture (A Lower, B Lower, and C Lower). (D–F) Citrate synthase activity (D), total ATP levels in glucose (E), and activity during incubation in galactose-containing medium (F) are shown. Data points F are means ± SD of at least five different experiments.

