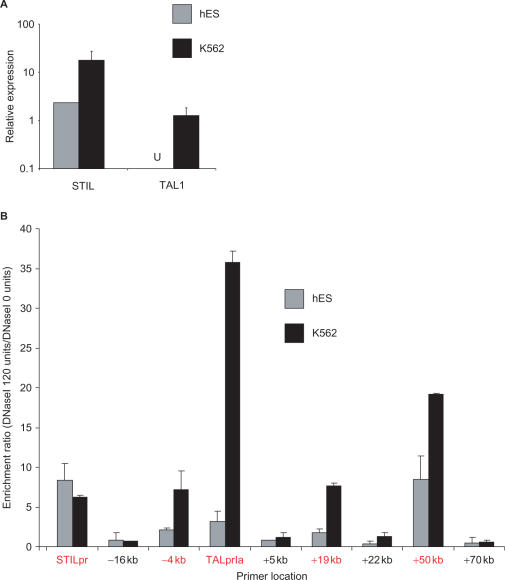
Figure 4.
(A) Quantitative reverse transcriptase PCR quantification of STIL and TAL1 expression in hES and K562 cells. Expression was normalised to β-actin and plotted as detailed in ‘Materials and methods’ section. Both cell types express STIL, but TAL1 transcripts were not detectable (U) in hES cells. (B) Quantitative real-time PCR DNaseI profiles from hES and K562 cells using nine primer sets across the TAL1 locus. Primer set numbers refer to approximate kilobases (kb) relative to the start of TAL1 exon 1a. Primer sets corresponding to known regulatory elements are highlighted in red. Profiles represent the mean ± SD enrichment of material derived from two independent hES cell biological replicates, and two independent K562 cell cultures. Each bar represents the mean ratio of enrichment obtained from DNaseI-treated samples versus DNaseI-untreated samples for each cell type. With both cell types, no enrichment is seen at the four control sites (−16, +5, +22, +70 kb). K562 cells show maximal enrichments at the TAL1 regulatory elements and the STIL promoter, while hES cells show the highest enrichments at the STIL promoter and +50 enhancer, with minimal enrichment at the other TAL1 regulatory elements.

