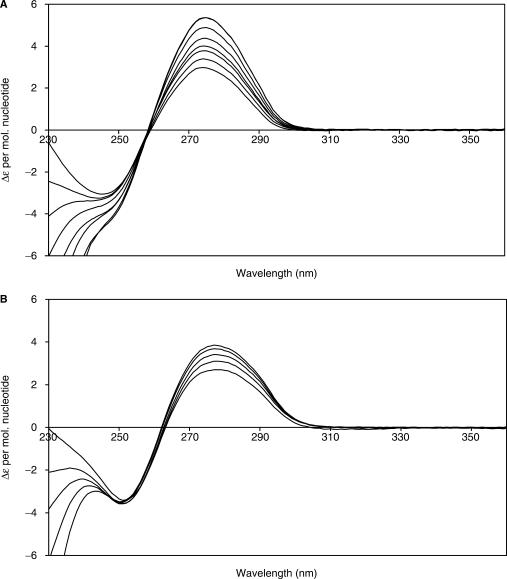
Figure 4.
CD spectra following C.AhdI binding. (A) The 35WT sequence and (B) the 35L sequence. Scans were taken from 360 to 230 nm for every 1 nm, following the addition of 50 μM aliquots of C.AhdI. Representative spectra are shown, corresponding to protein:DNA ratios of (a) 0, 0.54, 1.1, 1.6, 2.2, 3.0, 4.1 and 4.6 and (b) 0, 0.49, 1.0, 1.74 and 2.23. Experiments were carried out in 40 mM citrate pH 5.6, 100 mM NaCl, 1 mM EDTA, at 20°C.

