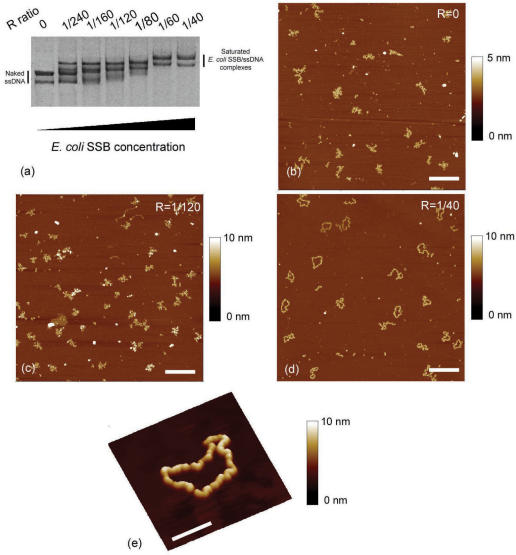
Figure 3.
(a) Agarose gel electrophoresis of M13 ssDNA–E. coli SSB complexes formed in spermidine buffer Tris 20 mM pH 7.5, NaCl 300 mM, SpdCl3 300 μM with increasing E. coli SSB protein concentration: free ssDNA (lane 1), R = 1/240 (lane 2), R = 1/160 (lane 3), R = 1/120 (lane 4), R = 1/80 (lane 5), R = 1/60 (lane 6) and R = 1/40 (lane 7). (b) AFM image of free M13ssDNA. (c) AFM image of M13 ssDNA–E. coli SSB complexes associated to lane 4. Due to the higher ionic strength, the cooperative binding of E. coli SSB to ssDNA is less pronounced than in Figure 2c. (d) AFM image of fully saturated M13 ssDNA–E. coli SSB complexes associated to lane 7 (scale bars 500 nm). (e) Zoom on a fully saturated M13 ssDNA–E. coli SSB complex (scale bar 100 nm).

