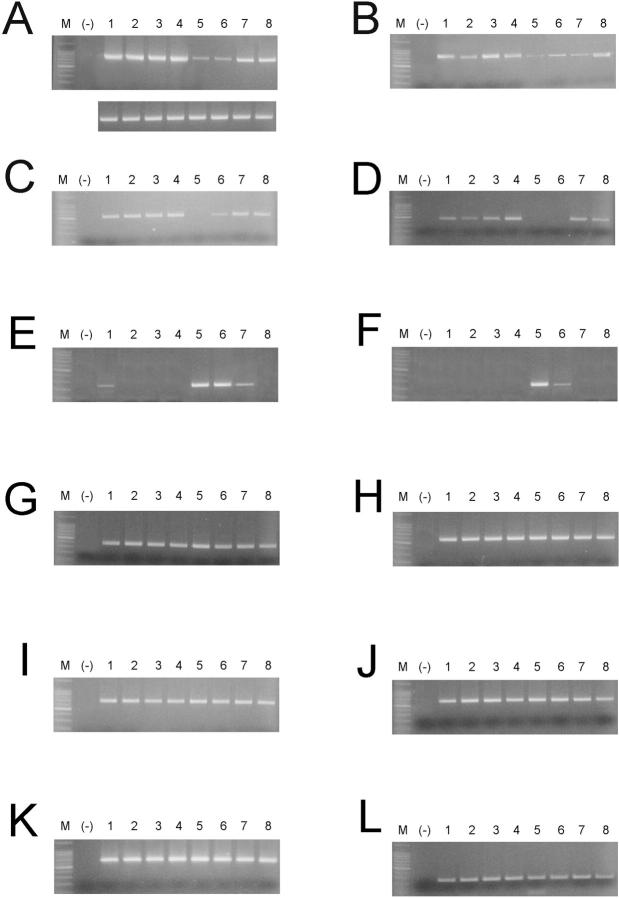
Figure 3.
RT-PCR analysis of hepatocyte marker expression in expanding clusters of SHPCs after PH in the livers of retrorsine-exposed rats. Portions of message were PCR-amplified using primers and annealing temperatures shown in Table 1 ▶ for CYP 2E1, 847 bp (A); CYP 3A1, 689 bp (B); TAT, 471 bp (C); α-1 AT, 398 bp (D); AFP, 252 bp (E); WT1, 200 bp (F); CYP 2B1/2, 380/404 bp (G); CYP 4A3, 573 bp (H); CYP 1A2, 664 bp (I); CYP reductase, 597 bp (J); albumin, 608 bp (K); and transferrin, 251 bp (L). M: 100-bp DNA ladder. (−), Negative control consisting of substitution of water for template in the PCR reaction. Lanes 1–4: RNA from hepatic megalocytes 5, 7, 14, and 30 days, respectively, after PH in retrorsine-exposed rats. Lanes 5–8: RNA from SHPCs 5, 7, 14, and 30 days after PH in retrorsine-exposed rats, respectively. To demonstrate equal template concentrations, amplification of actin mRNA for each sample is shown below A, corresponding to samples in respective lanes.

