
Figure 4.
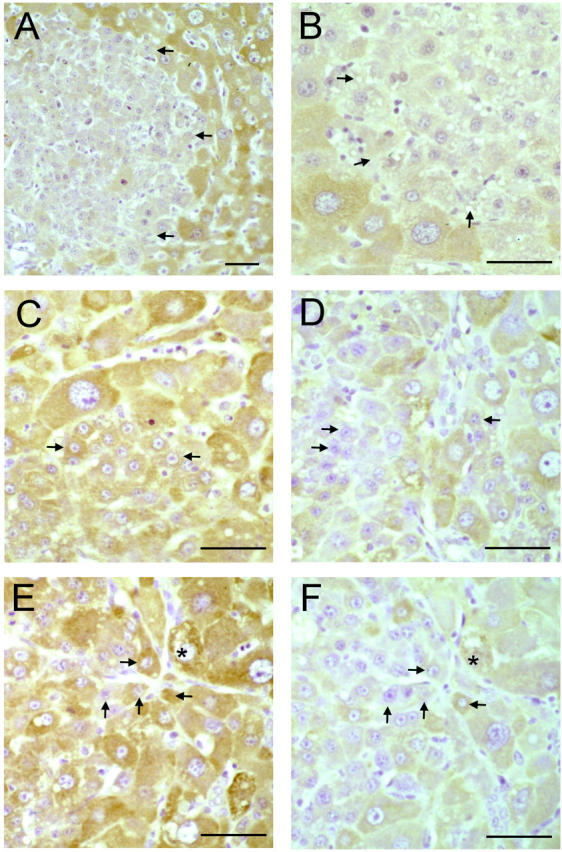
Immunohistochemical detection of cytochrome P450 isoforms in livers of retrorsine-exposed rats after PH. A and B: Indirect immunoperoxidase analysis of CYP 3A1 on liver sections from retrorsine-exposed rats 5 and 14 days after PH, respectively. C and D: Indirect immunoperoxidase analysis of CYP 2B1 and CYP 2E1, respectively, of tissue sections from retrorsine-exposed rats 3 days after PH. E and F: Indirect immunoperoxidase analysis of CYP 2B1 and CYP 2E1, respectively, on serial sections from retrorsine-exposed rats 5 days after PH. A subset of SHPCs in expanding clusters initiates expression of CYP 3A1 5 days after PH (A), although the vast majority of SHPCs still have undetectable (or very low) protein levels of this CYP isoform 14 days after PH (B). Nearly all SHPCs are CYP 2B1-positive 3 days after PH (C), and most are CYP 2E1-negative at the same time point (D). Serial section immunohistochemical analysis of CYP 2B1 (E) and CYP 2E1 (F) on tissue sections 5 days after PH confirms that the initiation of CYP 2B1 expression precedes CYP 2E1 expression. E and F: Note that cells are either positive for both CYPs (rightmost arrow), negative for both (leftmost arrow), or CYP 2B1-positive and CYP 2E1-negative (uppermost arrow). Bar, 50 μm. Arrows, small hepatocyte-like cells. * Reference point.