Figure 2.
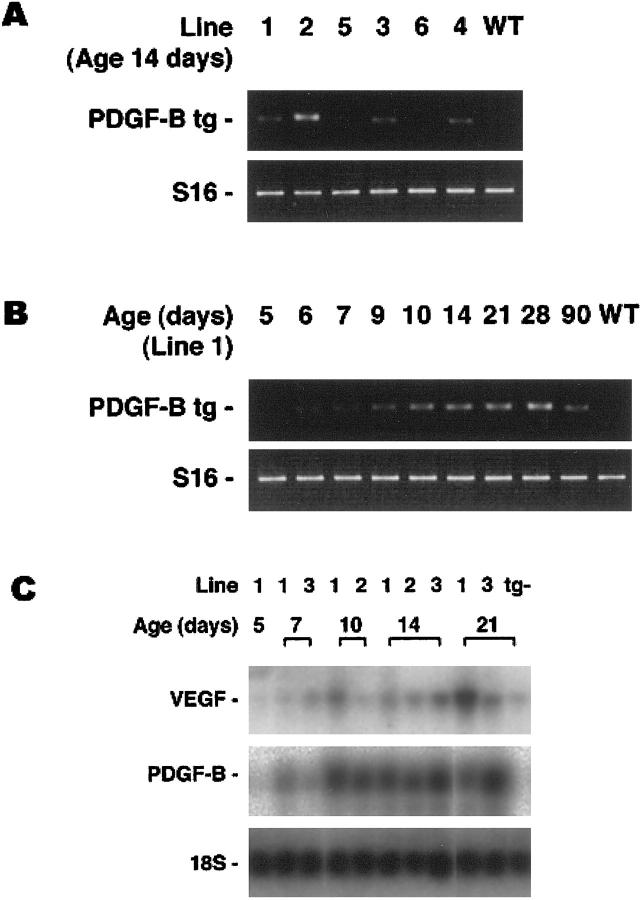
Assessment of transgene mRNA level in retinal RNA by RT-PCR and Northern blot analysis. A: Total RNA was extracted from the retinas of a transgene-negative (WT) and transgene-positive mice from 6 different lines (rho/PDGFB1–6) and RT-PCR was done for PDGFB transgene mRNA and S16 ribosomal protein mRNA. The size of the band amplified with transgene primers was compatible with the 693 bp predicted for amplification from mRNA. Lines 1–4 showed easily detectable expression, line 5 showed barely detectable expression, which reproduces poorly in this figure, and line 6 shows no detectable expression. B: RT-PCR was done for PDGFB transgene mRNA and S16 ribosomal protein mRNA on retinal RNA from different aged transgene-positive or -negative (WT) mice from line 1. Transgene mRNA is barely detectable at P5 (reproduces poorly in this figure) and increases to reach steady-state level between P10 and P14. C: Northern blot analysis shows PDGFB transgene mRNA detectable on P7, and there are similar levels on P10 and P14 in lines 1–3. There is also an increase in VEGF mRNA and at P21 transgene-positive mice show greater levels than transgene-negative mice (tg−).

