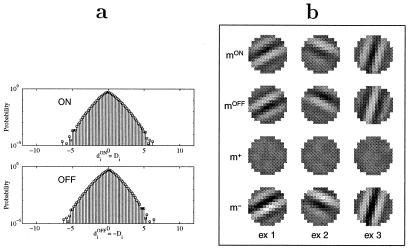
Figure 4.
LGN in the linear region, where diON = Di and diOFF = −Di. (a) Probability distributions (log-scale) of inputs from linear ON and OFF cells. Note that the distributions are almost symmetrical around spontaneous activity (di = 0). (b) Examples of final weight configurations mON, mOFF, m+, and m− (see text). Different columns (ex 1, ex 2, ex 3) represent results from simulations with different initial conditions and different sequences of inputs.

