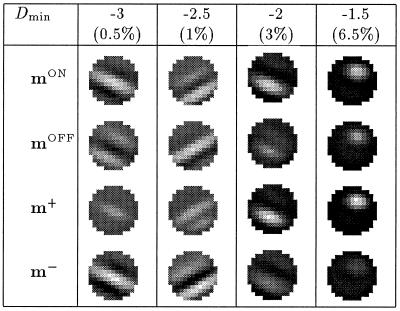
Figure 6.
Simulations results for cut-off at different values of Dmin; the percentage shows the fraction of the inputs that are cut-off at Dmin. The noise level SDn = 0.7. The figure shows that a stronger asymmetry in the inputs yields a change in the results, from reversed ON/OFF configurations mON ≈ −mOFF or m+ ≈ 0 (see, for example, Dmin = −3) to equal ON/OFF configurations mON ≈ mOFF or m− ≈ 0 (see, for example, Dmin = −1.5).

