
Figure 3.
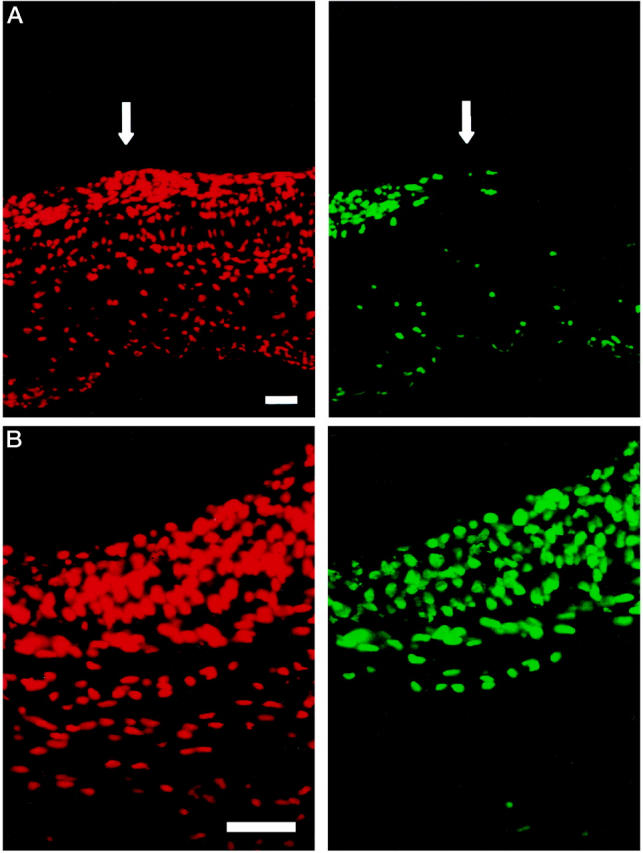
Fluorescent photomicrographs of a longitudinal section (A) and a cross section (B) of a balloon-injured rat common carotid artery 4 hours after PDT. Note the sharp demarcation line at the interface of the PDT-treated (left) and nontreated part (right) of the artery (arrow) in the longitudinal section. Note complete apoptosis of the neointima and beginning apoptosis of the media 4 hours after PDT (B). TUNEL staining, scale bars, 10 μm. The propidium iodide counterstain (red cells) was visualized using a filter of 450 to 490 nm for excitation and of 515 to 565 nm for emission. The corresponding apoptotic cells (green) were visualized using 564 nm for excitation and a long-pass filter of >590 nm for emission.