
Figure 1.
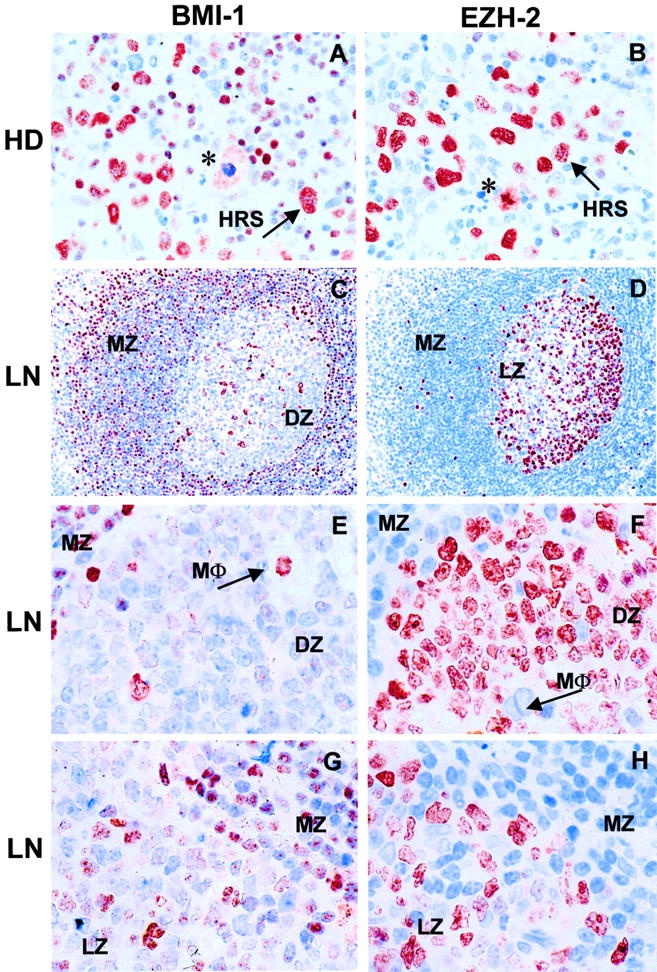
Immunohistochemical analysis of BMI-1 and EZH2 expression in HRS cells and germinal center follicular lymphocytes in the lymph node. A and B: Staining of Reed-Sternberg (HRS) cells for BMI-1 (A) and EZH2 (B). HRS cells express both BMI-1 and EZH2, whereas infiltrating lymphocytes stain for BMI-1 but not for EZH2. Note that dividing cells express BMI-1 in the cytoplasm, whereas EZH2 remains associated with condensed chromosomes (indicated by * in A and B). C, E, and G: Expression of BMI-1 in germinal centers of the lymph node. D, F, and H: Expression of EZH2 in germinal centers of the lymph node. C and D: Overview of lymph node germinal center. E and F: Detail of germinal center showing dark zone (DZ) and mantle zone (MZ). G and H: Detail of germinal center showing light zone (LZ) and MZ. Cb, centroblast; cc, centrocyte; LN, lymph node; MΦ, macrophage. Note that the mutually exclusive expression of BMI-1 and EZH2 is particularly notable in the MZ, DZ, and MΦ staining profiles (C−H), whereas HRS cells stain for both PcG proteins (A and B). Original magnifications, ×400 (A and B), ×200 (C and D), and ×630 (E−H).