
Figure 7.
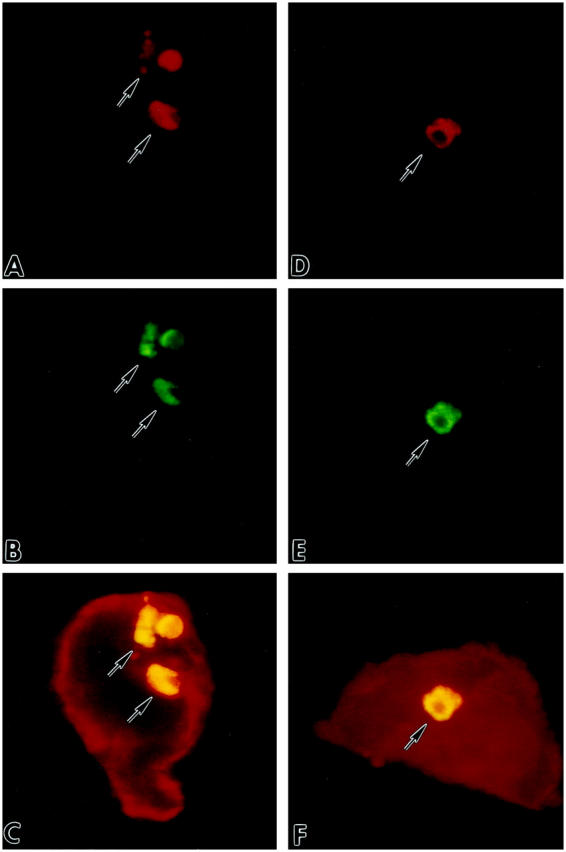
A and D illustrate nuclei by red fluorescence of PI; B and E show by green fluorescence TdT (B) and hairpin (E) labeling of apoptotic nuclei; myocyte cytoplasm is depicted by red fluorescence of α-sarcomeric actin staining in C and F. Yellow fluorescence represents the combination of PI and TdT (C), and PI and hairpin (F) labelings. Confocal microscopy, ×1,200.