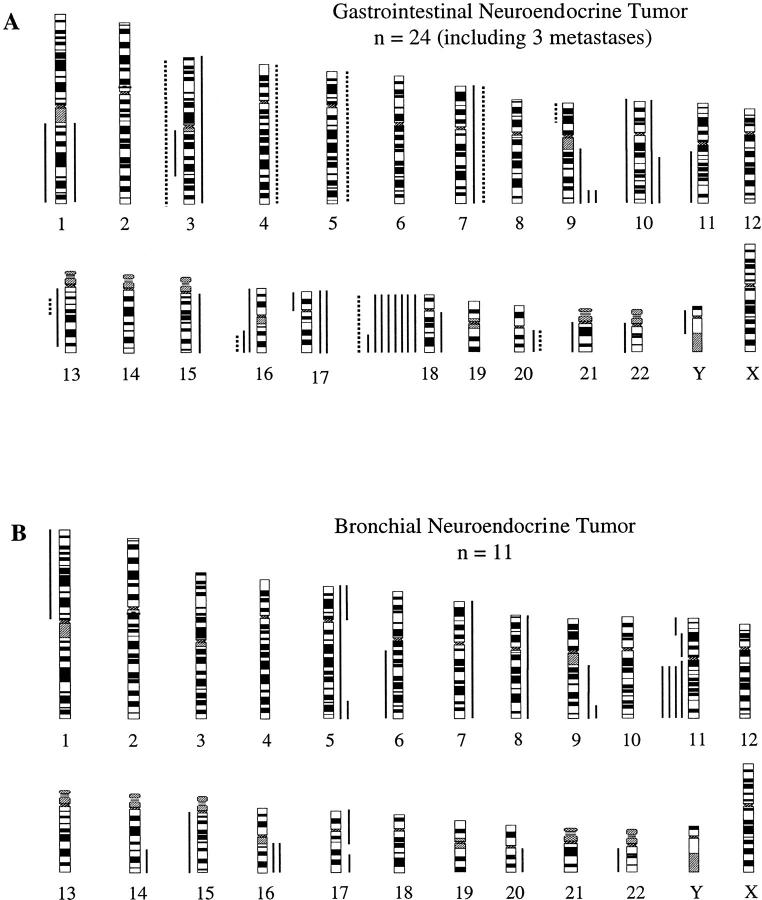
Figure 1.
Summary of all DNA copy number alterations detected by CGH in 21 gastrointestinal NETs and three associated metastases (A) and 11 bronchial NETs (B). The vertical green lines on the right of the chromosome ideograms indicate gains, the red on the left losses of the corresponding chromosomal regions. The solid and dotted lines in (A) represent genomic alterations detected in primary gastrointestinal NETs and associated metastases, respectively. Each line represents one alteration.

