
Figure 3.
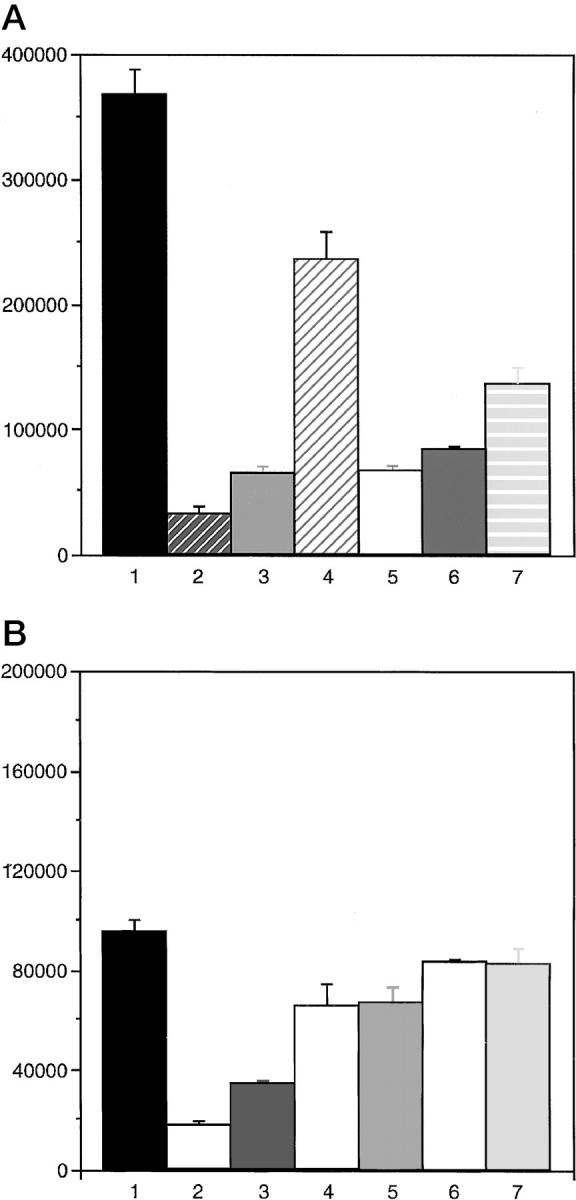
A: Dose response of SVRbag4 cells to the MAPKK inhibitor PD98059 and the PI-3-K inhibitor LY294002. The first lane represents cell counts of untreated cells; the second lane, cells treated with 10 μg/ml LY294002; the third lane, 5 μg/ml LY294002; the fourth lane, 1 μg/ml LY294002; the fifth lane, 10 μg/ml PD98059; the sixth lane, 5 μg/ml PD98059; the seventh lane, 1 μg/ml PD98059. Cells were treated with inhibitor for 72 hours, and cells were counted. All experiments were repeated in triplicate, and the error bar represents SEM. All doses of inhibitors resulted in significant inhibition compared with untreated cells, P < 0.05. B: Dose response of SVRA221a cells to the MAPKK inhibitor PD98059 and the PI-3-K inhibitor LY294002. The lanes are labeled as in A. Cells were treated as in A. All experiments were performed in triplicate, and the error bar represents SEM, P < 0.05. Treatment of SVRA221a cells with the PI-3-K inhibitor led to significant decreases in cell proliferation (P < 0.05), but there was no significant decrease in proliferation as a result of treatment with the MAPKK inhibitor PD98059.