
Figure 2.
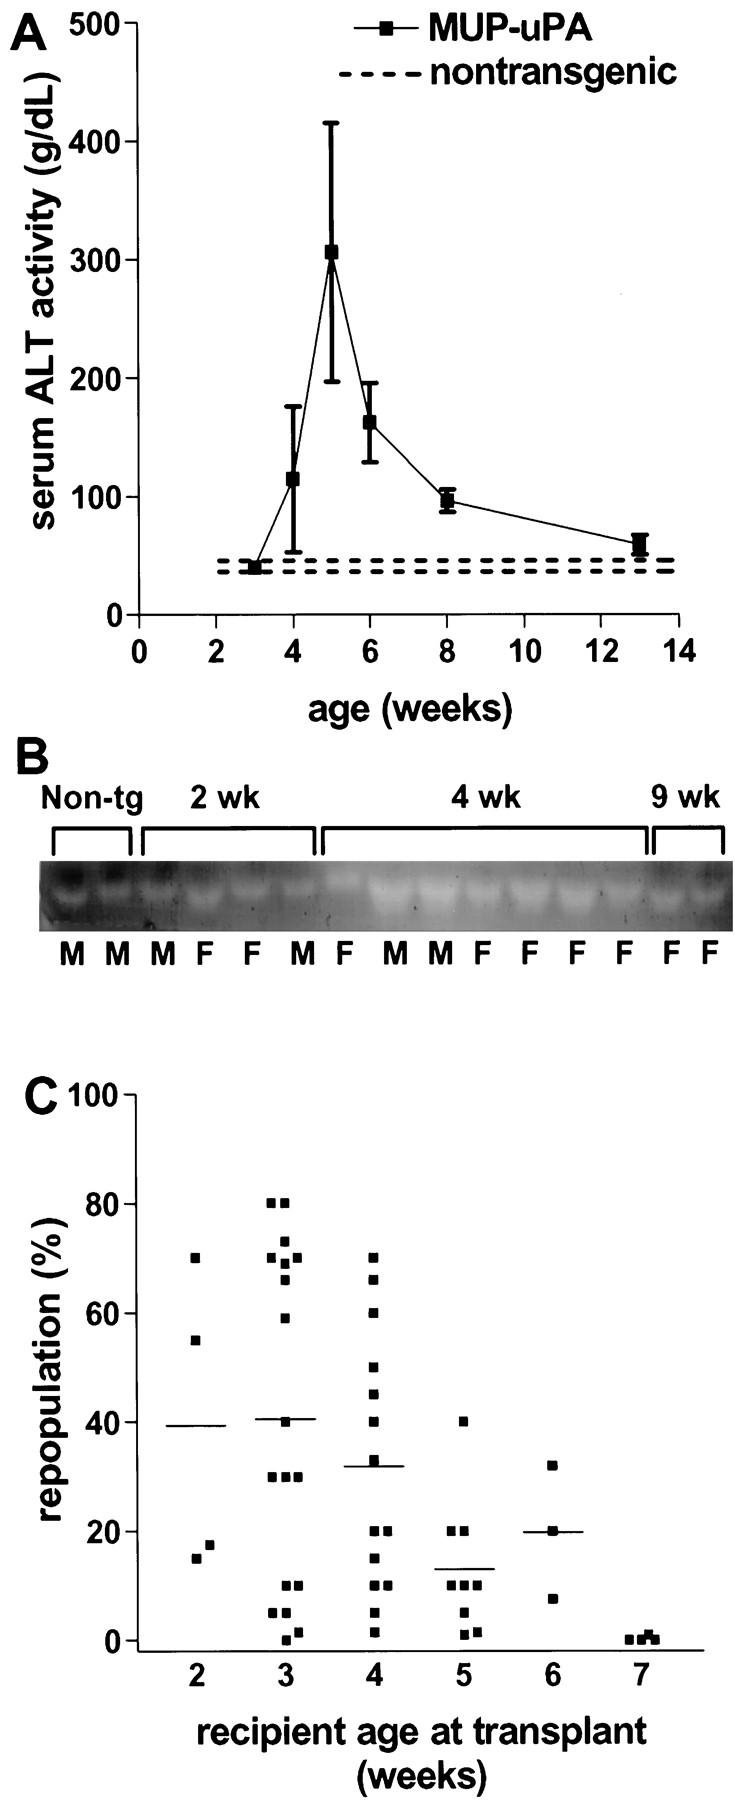
Liver disease and donor cell repopulation in MUP-uPA transgenic mice. A: Serum alanine aminotransferase activity in MUP-uPA transgenic mice. All values except those at 3 and 13 weeks are significantly elevated relative to pooled controls (P < 0.03, unpaired t-test). Each point for transgenic mice represents the mean ± SD of three to seven samples. Dashed lines indicate the two standard deviation range for values from nontransgenic littermate control mice (n = 5). B: Zymographic analysis of uPA in mouse serum as a function of mouse age. The intensity of each band is proportional to the amount of uPA catalytic activity present in that sample. Non-tg: serum from 4-week-old nontransgenic control mice. Letters below each lane indicate female (F) or male (M). C: Extent of repopulation by donor hepatocytes in MUP-uPA transgenic mice as a function of recipient age. Each point represents one mouse liver. Bars indicate mean values.