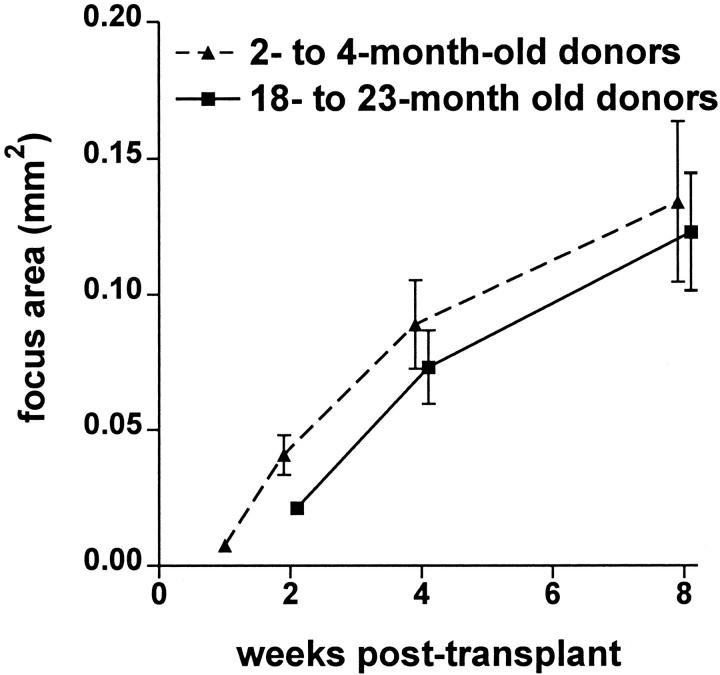
Figure 3.
Rate of donor cell hepatic reconstitution. Solid triangles indicate the cross-sectional area of donor-derived foci after transplantation of hepatocytes isolated from 2- and 4-month-old hPAP transgenic donors (pooled data from two experiments). Area was measured on the liver surface, not on sectioned tissue. It therefore represents true focus cross-sectional area, and will not be biased by random cross-sectioning of foci. Each data point represents the mean ± SEM of cross-sectional area of 50 donor-derived foci from each of four to eight recipient mice. Solid squares indicate the cross-sectional area of donor-derived foci after transplantation of hepatocytes isolated from 18- and 23-month-old MT-hPAP transgenic donors (pooled data from two experiments). Each data point represents the mean ± SEM of cross-sectional area of 50 donor-derived foci from each of three to seven recipient mice. At 2, 4, and 8 weeks, data points are offset for ease of visualization.

