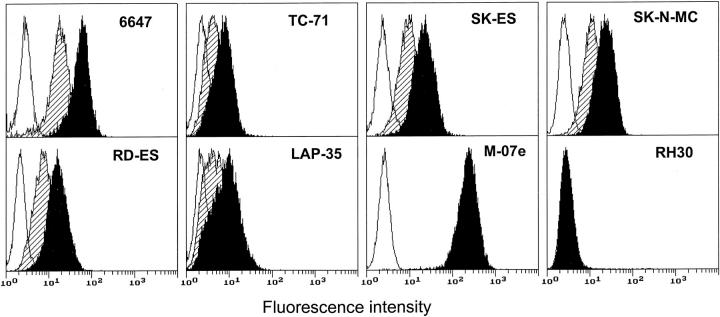
Figure 1.
Cytofluorometric analysis of c-kit expression in human Ewing’s sarcoma cells with or without in vitro SCF pretreatment. Open profile represents cells stained with secondary antibody alone; solid profile represents cells stained with the anti-c-kit antibody; shaded profile represents cells cultured in the presence of SCF (10 ng/ml for 48 hours) and stained with the anti-c-kit antibody. The megakaryoblastic cell line M-07e and the rhabdomyosarcoma cell line RH30 were used as positive and negative controls, respectively. In each panel, the ordinate represents the number of cells. Data from an experiment representative of at least two similar experiments are shown.

