
Figure 5.
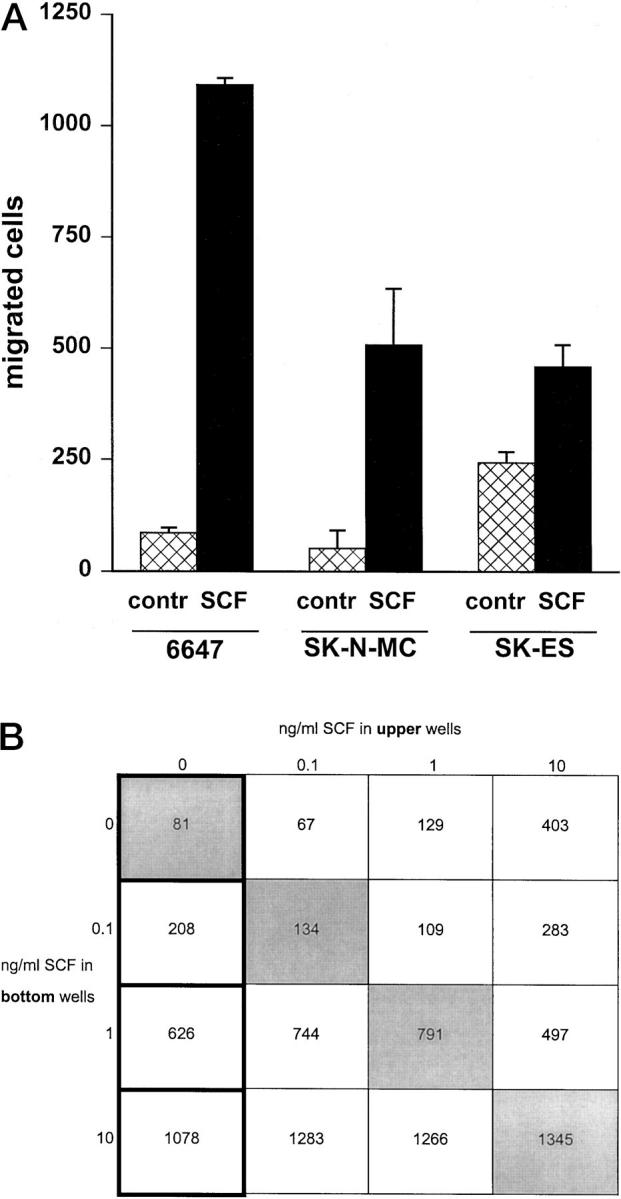
SCF effect on migration ability of human Ewing’s sarcoma cells. A: Migration of 6647, SK-N-MC, and SK-ES cells in response to SCF (10 ng/ml) used as a chemoattractant in the lower compartment of a Transwell chamber. Each bar represents the mean ± SE of three independent experiments. Migration in a positive gradient of SCF was significantly higher than toward control medium (P < 0.05, Student’s t-test). B: Checkerboard analysis of 6647 migration in response to SCF. In each square the number of migrated cells is reported. The first column represents the dose-dependent chemotactic response in a positive gradient of SCF. Squares below the diagonal (upper left corner to lower right corner) represent a positive gradient of SCF and measure chemotactic response. Squares along the diagonal represent equivalent SCF concentrations in upper and lower wells of the migration chamber. Squares above this line represent a reversed gradient of the factor.